
Google Analytics is an excellent tool for charities. It’s free (always important when you’re a non-profit and your budget is tight) and it can give you incredible insights into your web visitors.
Used correctly, you’ll gain valuable information about content that encourages people to volunteer or donate.
But it can be overwhelming. With so much information available to the user, how do you identify which statistics you should be paying attention to? And once you know, what do you do about improving them? Here are the key numbers to look at.
1. Users and New Users
 Found under the ‘Audience’ heading on the ‘Overview’ tab, these statistics will give you a good indication of how many people are visiting your website.
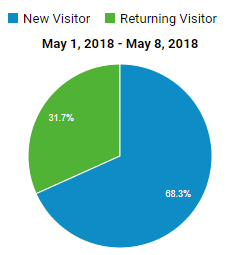
Users is the number of people who’ve accessed your website overall. New users is the number of new visitors to your website (not to be confused with unique users, which is the number of individual visitors in a specific date range).
If you’re trying to encourage more visits to your website, it’s likely that you’re focusing on increasing your new users. Improve this statistic: Increasing your marketing activity online and offline should increase interest in your charity and therefore visitors to your website.
2. Bounce Rate
A bounce is when someone visits your website and then leaves immediately. Your bounce rate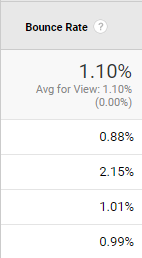 can tell you a number of things about your website.
If your bounce rate is really high, then people probably aren’t enjoying your content. Maybe you are marketing yourself to the wrong people.
Improve this statistic: First, work out why people are bouncing off your website in the first place. Is your content boring? Is there no reason to stay once somebody read one thing? If you see a sudden increase in bounce rate, something technical might have gone wrong on your website, so check how it’s performing on different devices and browsers.
3. Average Session Duration
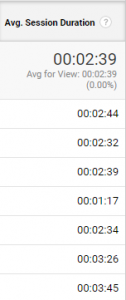 Google Analytics monitors how long each visitor spends on your website and then works out the average amount of time people are reading or watching your content.
Some pages should have a higher average session duration than others. You’d expect someone to spend more time reading blogs than short pages, for example, but if people are spending a large amount of time on your donate page and then not donating, that might indicate that they find the process confusing. Improve this statistic: If people are hanging around on pages they shouldn’t be for a long time, conduct some user testing via a site like usertesting.com and see where people are getting stuck. If they aren’t hanging around to read what you thought was great content, it’s time to critically evaluate it.
4. Sources for incoming traffic
Chances are that a lot of your marketing activity is pointing towards your website. So it’s really important that you know where your traffic is coming from to evaluate your marketing efforts.
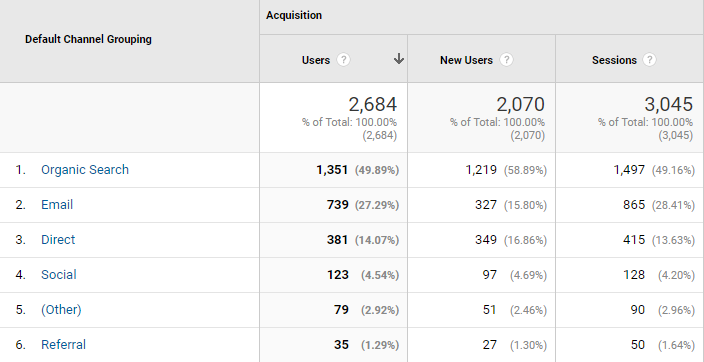
Head to Acquisition, then All Traffic and then Channels to find information about where your visitors came from. You can drill down further by clicking on any of the groupings; ‘Social’ will be broken down into Twitter, Facebook and LinkedIn, for example.
This is really helpful if you’re running an advertising campaign across a specific channel.
Improve this statistic: This one isn’t really about improvement – ideally, you’ll have a good mix of sources of traffic so you aren’t reliant on any single one. Look at the sources of traffic that drive the most conversions (like donations) and focus your marketing activity by getting even more.
5. User flow
Here, you can see where people have entered your website and where they clicked to next. You can also see where people have decided to drop off.
This is found in Audience and then User Flow. If you’re seeing a huge drop off on a particular page, something is wrong. If you’re trying to direct people from page to page through a funnel, this is a good place to investigate the natural progression of a user through your website.
Improve this statistic: If one of your pages has a weirdly high number of exits, you need to have a look at why. Are they attractive? Easy to navigate?
Do more user testing, or ask your email or social followers for feedback on that page.